

Sales forecasting is essential for any business that wants to stay ahead of the competition. By accurately forecasting sales, businesses can make better decisions about resource allocation, pricing, and marketing.
Salesforce Forecast Charts is a powerful tool that can help businesses visualize their forecasts and identify areas where they need to improve. With Forecast Charts, sales managers can see the changes to the current period’s forecasts across forecast types and measure how this period’s forecasts compares to past periods.
Forecast Changes chart
The Forecast Changes chart is a great way to see how the current forecast has changed week to week by forecast category. This chart can help you identify areas where your sales are trending upwards or downwards, and it can also help you identify opportunities for further investigation.
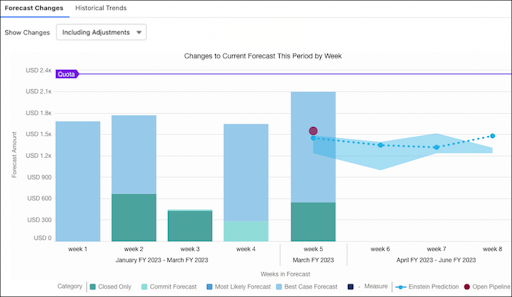
To use the Forecast Changes chart, simply hover over each segment to see more details about the changes compared to the previous time segment. If Einstein Forecasting is enabled, this chart will replace the Einstein Forecasting chart on the forecasts page.
Historical Trends chart
The Historical Trends chart is another helpful tool for visualizing your forecasts. This chart shows how forecasts for the current period compare to the same time in past periods. This can help you identify areas where your sales reps or managers need assistance and mentoring, and it can also help you identify areas where you are excelling.

To use the Historical Trends chart, simply select a forecast category from the drop-down menu. The chart will then show you how forecasts for that category have changed over time.
Salesforce Forecast Charts is a powerful tool that can help businesses improve their sales performance. By visualizing your forecasts and identifying areas for improvement, you can make more accurate predictions and stay ahead of the competition.
If you’re looking for a way to improve your sales performance, Salesforce Forecast Charts is a great place to start. To learn more, visit our website or contact us today.