The latest update in Salesforce is bringing improvements to the forecasting functionality and we at Skyblux have decided to explain the improvements and how they are going to help your business.
Modern forecasts page
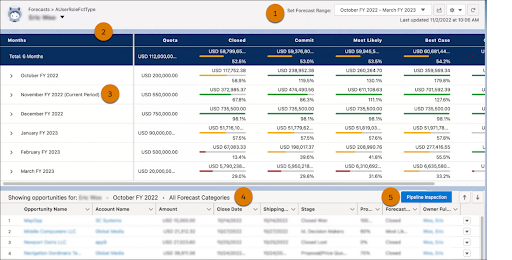
The forecast page has been update with a modern design and new improvements:
- The “Set Forecast Range” option is available directly on the page, saving your sales leaders clicks to view a different range.
- The forecast summary header is now “blue”, to better highlight the column headings and align with other features, such as the pipeline.
- The “Current Period” is shown in the summary view.
- The list of opportunities provides more details about the opportunities.
- If you have “Pipeline inspection” enabled, the button is now “Blue”, making it easier to find when you are ready to view the pipeline in more detail.
In addition, users of the forecast page quickly see the changes that took place in the last 7 days, if historical trending is enabled. They can also see the quota fulfillment percentages, if they are enabled. Users can still choose to hide that information in the page display settings.
Creating custom forecast pages with Lightning App Builder
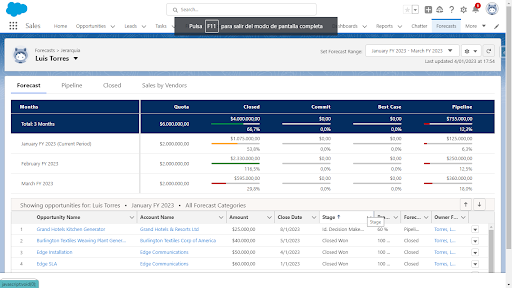
You can now design several forecast pages and choose which pages to activate and assign to applications and users.
Let’s take a look!
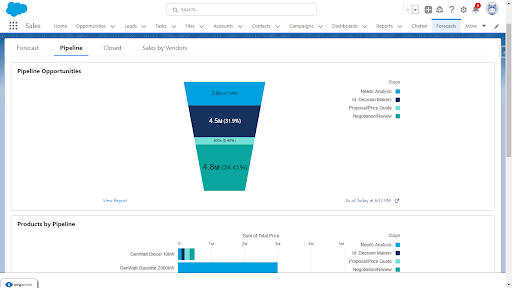
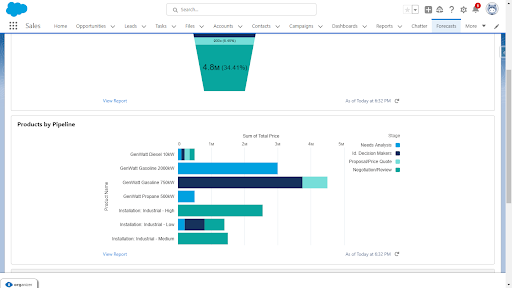
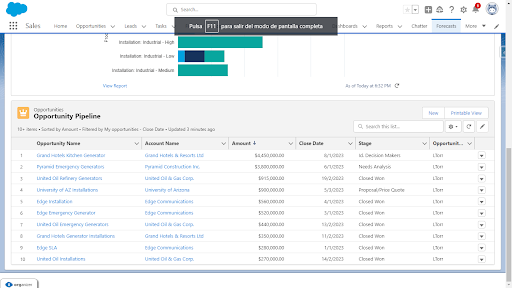
The sales department not only wants the users to see the forecasts, but also to be able to see various charts and components of the sales process on the same page.
After the Salesforce administrator makes the changes in the system, the salesperson has on the same page several tabs with charts and lists according to their needs. The salesperson can choose the pipeline tab and see the charts with the opportunities and products he is working on, without the need to change pages or applications.
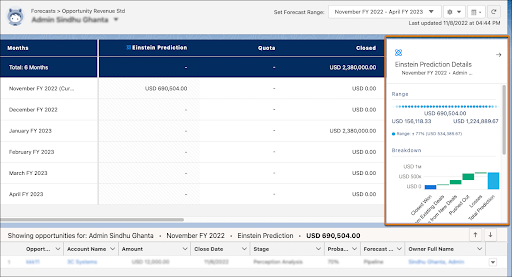
If the “Einstein Forecast” option is enabled, the user can select a value in the Einstein Forecast column and it will be displayed at the same height as the Forecast Summary component.
Forecast tracking with customized date
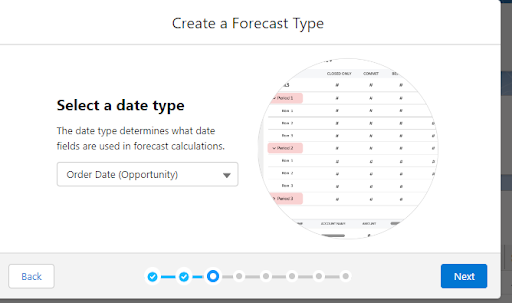
Now you can use another date in addition to the opportunity close date and create another forecast based on that date. For example, you can create an order date and thus manage a forecast based on that date, in addition to the sales forecast with closing date.
Forecasting is a very important tool in sales and commercial management. With these enhancements and additional functionalities, you will be able to make a more detailed and deeper analysis of the sales cycle that will help you make the right decisions based on real data, all in real time.


